Power BI for mining sites, from the pit to the plant
Power BI for mining connects what happens in the pit, the plant and the workshop with what finance books at month end. Tons moved, grade, recovery, equipment hours and cost per ton then share one report. Most sites hold this data already, but in systems that never meet. Our consultants build the model online, inside your own Microsoft tenant, with a demo each week.
- Tons and grade by shift
- Equipment availability
- Cost per ton
Last updated
Why do site teams adopt Power BI for mining?
A mine runs around the clock, and every shift leaves a trail of records. Dispatch logs loads and cycle times. The plant logs feed and recovery. Maintenance logs breakdowns. Yet the shift report that joins them often comes from one person and one spreadsheet.
That process is fragile. If the person is away, the report is late. If a formula breaks, nobody notices for days. Also, the spreadsheet cannot easily show a whole month next to a single shift.
A model in Power BI keeps the logic in one place. It loads each system on a schedule and applies the same rules every time. So a superintendent compares crews, pits or weeks without asking anyone to rebuild a file.
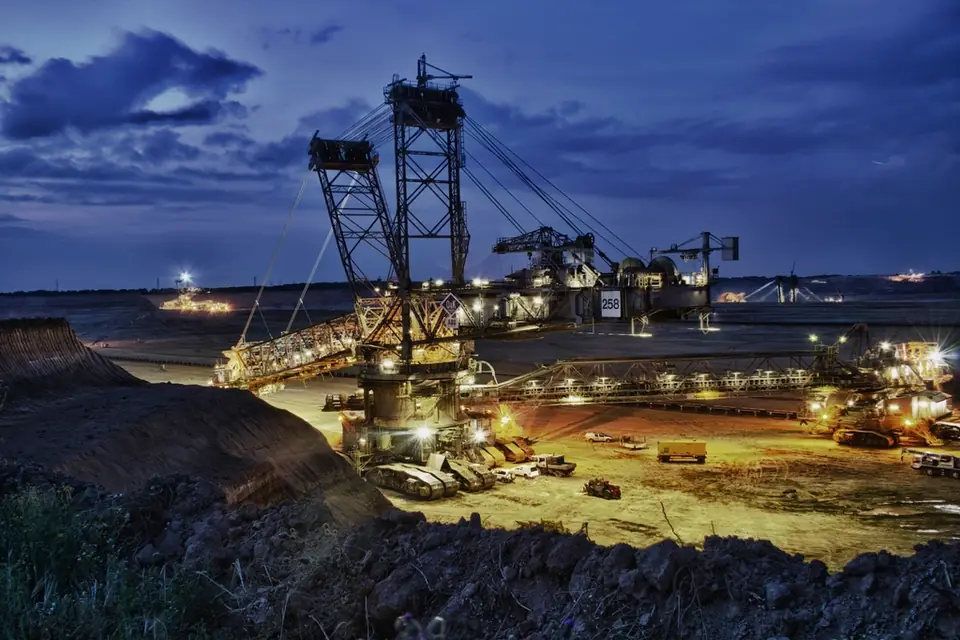
Mine site dashboards for operations, plant and safety
Each page below serves a different meeting, so most sites begin with the one that hurts most.
Production against plan
Ore and waste tons appear by shift, crew and pit beside the mine plan, so shortfalls show while they are small.
Grade and recovery
Head grade, recovery and product output sit together. Therefore the plant team sees how feed quality moves the result.
Equipment availability
Hours available, used and down appear for each truck and shovel. Then planners know which units hold the fleet back.
Haul cycle detail
Queue, load, travel and dump times break apart by route, because the slowest part of a cycle is rarely the obvious one.
Unit cost
Fuel, labor, parts and contractor spend roll up per ton. As a result, finance and operations argue less over the basis.
Safety observations
Incidents, near misses and inspections show by area and type, so supervisors act on patterns instead of anecdotes.
Which mining systems supply data to a Power BI report?
Four or five sources cover most sites. A fleet management system records loads and cycles. A plant historian records process readings. Also, a laboratory system holds assays. Then a maintenance system and an ERP hold work orders and costs.
Remote sites add a practical limit. Links can be slow or unstable, so we plan refresh around them. For example, an on-premises data gateway at site can send a compact nightly load instead of raw detail. Incremental refresh also helps, since it reloads only recent periods.
Units and names need one standard. One system may count wet tons while another counts dry. Therefore we write each definition down with your engineers before any measure exists. After that, a figure on the page means the same thing to every reader. Site servers usually sit behind a firewall, so a power bi gateway setup links them to the cloud service.
When Power BI for mining makes sense
A site usually calls once a few of these have become normal.
- Shift reports depend on one spreadsheet
- Plant and pit tons never reconcile
- Breakdown causes sit in free text
- Cost per ton arrives after month end
- Head office asks for the same data twice
- Safety trends take days to compile
How a Power BI for mining engagement runs
We keep the stages short, because site leaders have little time away from operations.
Free first call
First you show us the current shift or monthly report. In thirty minutes we say what a model would change.
Written quote
Then the scope arrives in writing. It names each system, each page and each definition still open.
Definitions workshop
We settle tons, grade and availability rules with your engineers before building, so later totals need no debate.
Weekly demo and handover
Each week you open a working page and comment. Finally the model, the notes and a recorded walkthrough become yours.
Mine reporting with Power BI: questions from site teams
Does Power BI for a remote site work with a slow connection?
Yes, with some planning. The gateway at site sends data to the Power BI service on a schedule, so the link only carries each load. We keep those loads small by summarizing detail first. Reports then open from the cloud, which means head office does not depend on the site link at all.
Can Power BI read data from a mining fleet management system?
Usually, but the route varies by vendor. Many fleet systems store data in a SQL database that Power BI can query through a gateway. Others offer exports or an API instead. During the assessment we ask which product and version you run. Then the quote states the exact route, with no guesswork.
Is Power BI for supervisors usable on a tablet?
They can. Power BI offers mobile apps for phones and tablets, and reports resize for them. We also design a simple layout for the pages a supervisor checks in the field. Because the figures come from the same model, the tablet view and the office view always match.
How do we stop each site from seeing the others?
Row-level security handles that. The model filters data by the signed-in user, so a site manager sees one operation. Corporate roles still see every site side by side. Since the rule lives in the model, new reports follow it without extra work. We test every role with you before launch.
What kind of firm is Power BI Agency?
A small one, by design. Power BI Agency is a division of Sataware Technologies and works independently of Microsoft. Our consultants do the work, and delivery is online. We also answer inquiries within 2 hours. If a call suits you better, the number is (480) 485-7373.
Let's build your first dashboard together.
Tell us what you report on today. A consultant replies within 2 hours with next steps.
Trusted partners
Microsoft Solutions Partner · AWS Partner
Cloud & AI Platforms
Azure SQL, Microsoft Fabric and the data pipelines behind your reports.
AI Business Solutions
Power BI reporting on your Dynamics 365, Business Central and Power Platform data.
Security
Row-level security and Entra ID sign-in on every report and workspace.
Amazon Web Services
Power BI on your AWS data, with connectors for Redshift, Athena and S3.