Power BI for logistics and supply chain performance
Power BI for logistics follows each order from allocation to proof of delivery, so on-time and in-full figures rest on one definition. Data from your TMS, WMS, ERP and carrier feeds lands in one model. Then dispatchers, account managers and finance read the same numbers, from the morning stand-up to the quarterly review.
- OTIF by customer
- Carrier scorecards
- Freight cost per shipment
Last updated
What does on time really mean in your network?
Ask three teams and you may get three answers. Sales measures against the date the customer asked for. Operations measures against the promised date, and carriers measure against their own appointment. Each figure is right on its own terms, yet they never match.
So we agree one definition in writing before building anything. It covers the reference date, the delivery window, partial shipments and whether OTIF counts by line or by order. Then every report uses that rule, and customer reviews stop turning into debates about method.
The same care applies to cost. Freight cost per shipment depends on how accessorials, fuel surcharges and credits are allocated. Therefore the allocation rule goes into the model once, with a clear note for finance.
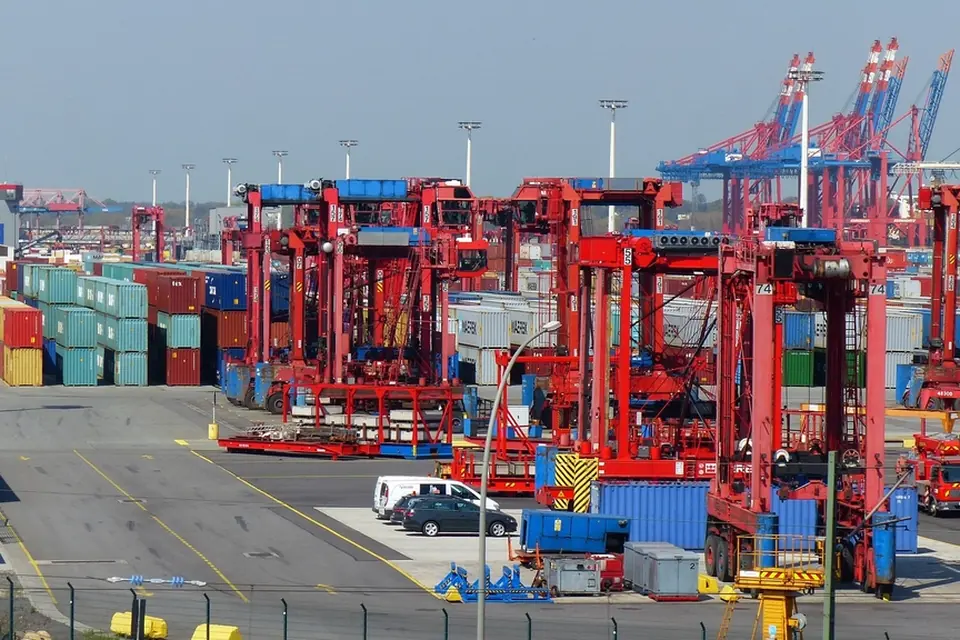
Following an order through Power BI for logistics
The model tracks four stages, and each one has its own timestamps and owners.
Order and allocation
Order lines, requested dates and stock allocation from the ERP set the baseline for every later measure.
Pick, pack and ship
Warehouse scans show throughput and dwell time, so delays inside the building stand apart from carrier delays.
In transit
Carrier status messages and tracking feeds show where each load is against its appointment.
Delivered and invoiced
Proof of delivery and the freight invoice close the loop on service and on cost per shipment.
Scorecards that change carrier conversations
Shared facts make quarterly carrier reviews shorter and more useful.
Carrier performance
On-time pickup and delivery by carrier, lane and month, using the definition both sides agreed.
Freight spend
Cost per shipment, per unit and per mile, with accessorials and surcharges broken out by carrier.
Warehouse throughput
Orders, lines and units shipped per day by site, with backlog and late shipments flagged.
Systems behind Power BI for logistics reporting
Most supply chains run on several systems, and each one holds part of the story.
- Transportation management systems via database, API or export
- Warehouse management systems and scanner data
- ERP order and inventory data, for example NetSuite or Business Central
- Carrier tracking feeds and EDI status messages
- Freight audit and invoice files
- Spreadsheets still used for rate tables or lane plans
Why does carrier data disagree with your own records?
Carriers use their own status codes, time zones and reference numbers. One carrier marks a load delivered at the gate, while another waits for a signature. So we map each carrier's codes to a shared set of events before any scorecard goes live.
Reference numbers cause the rest of the trouble. A shipment may carry a PO number, a BOL number and a PRO number, each from a different system. Therefore the model keeps a cross-reference table, and records with no match appear on an exceptions page for follow-up.
Once the data agrees, narrower views follow quickly. A power bi supply chain dashboard covers planning and supplier lead times, and a power bi warehouse dashboard focuses on the building. For your own trucks, a power bi fleet management dashboard tracks vehicles and drivers.
Pages for the dispatch desk and the boardroom
Dispatchers need today: loads at risk, late pickups and open exceptions. Leadership needs trends: service by customer, cost per shipment and carrier mix over time. Both read from one model, so a late load on Monday shows up in the monthly trend too.
Refresh needs differ as well. Pro allows up to 8 scheduled refreshes a day, while Premium Per User and capacities allow up to 48. For faster views, DirectQuery can read a well-tuned source directly, at some cost to report speed.
Power BI for logistics: questions answered
As a 3PL, can we use Power BI for customer-facing reports?
Yes. Row-level security shows each customer only their own shipments from one shared report. For a branded portal, Power BI Embedded puts reports inside your application, and your customers then need no Power BI license. Which route fits depends on how many customers you serve and how they sign in.
How often can Power BI for dispatch reporting refresh?
Scheduled refresh runs up to 8 times a day on Pro and up to 48 times on Premium Per User or a capacity. For near-live dispatch views, DirectQuery reads the source on demand instead. We help you choose, because the right answer depends on the source system and its load.
Our carrier data is inconsistent. Is that a blocker?
No, it is normal. We map each carrier's codes to shared events and flag records that fail to match. Then an exceptions page shows what needs attention. Over time, the scorecard itself gives you leverage to ask carriers for cleaner data in their status messages.
Can Power BI map lanes across a logistics network?
Yes. Map visuals show lanes, origins and destinations, colored by volume, cost or service level. Precise addresses work better than city names for geocoding, so we clean location data first. For heavy routing analysis, a specialist tool may still suit better, and we say so when it does.
What do we own at the end of the project?
Everything stays in your tenant: the semantic model, the reports, the refresh setup and the written documentation. We work through accounts you control and do not copy data to our own systems. Your analysts can extend the model, or you can ask for further help later.
Related pages
Let's build your first dashboard together.
Tell us what you report on today. A consultant replies within 2 hours with next steps.
Trusted partners
Microsoft Solutions Partner · AWS Partner
Cloud & AI Platforms
Azure SQL, Microsoft Fabric and the data pipelines behind your reports.
AI Business Solutions
Power BI reporting on your Dynamics 365, Business Central and Power Platform data.
Security
Row-level security and Entra ID sign-in on every report and workspace.
Amazon Web Services
Power BI on your AWS data, with connectors for Redshift, Athena and S3.