Power BI for manufacturing, from the line to the boardroom
Power BI for manufacturing gives plant managers, supervisors and finance one version of OEE, downtime, scrap and cost per unit. Machine data, MES records and ERP transactions come together in one model with agreed definitions. As a result, the shift meeting and the monthly review discuss causes, not whose number is right.
- OEE by line and shift
- Downtime reasons ranked
- Scrap and rework traced
Last updated
Why do plant numbers rarely agree?
OEE looks simple: availability times performance times quality. Yet every term hides a choice. Does a changeover count as planned downtime? Which ideal cycle time applies to each product? Do reworked units count as good?
Different answers produce different OEE figures for the same shift. Moreover, ERP production counts rarely match MES counts, because each system records at a different moment. So the first job is to agree the definitions with operations and finance, then write them down.
After that, the model applies the same rule everywhere. A supervisor and the plant controller then see the same figure, and any gap points to a real problem on the line.
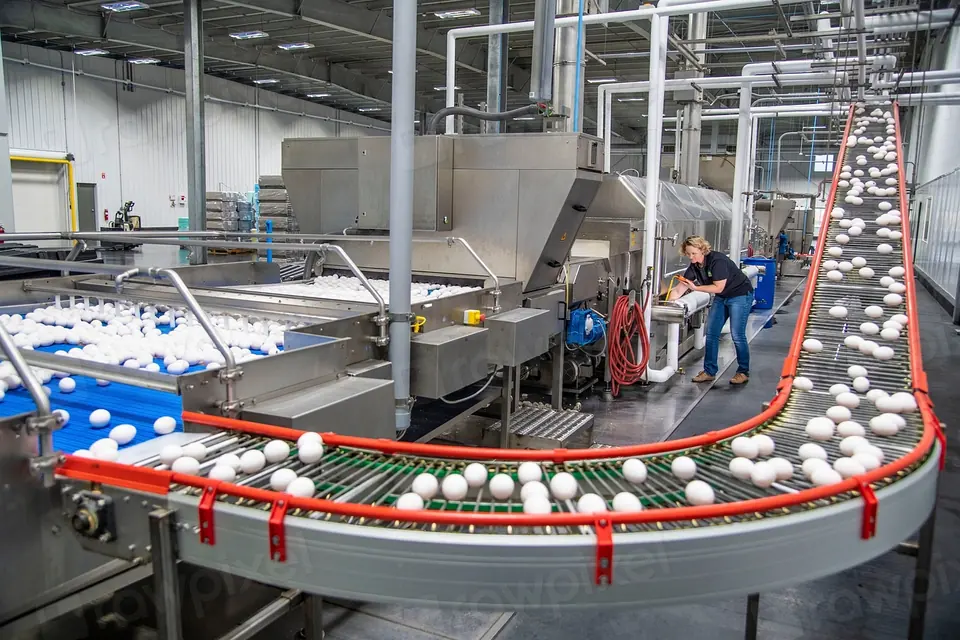
Questions Power BI for manufacturing should answer
These six areas cover most plant reviews, and each one can stand alone.
OEE by line and shift
Availability, performance and quality per line, shift and product, with trends over weeks.
Downtime reasons
Stops ranked by duration and frequency, so the biggest losses get attention first.
Scrap and rework
Defects by product, line and cause, traced back to batches or shifts where possible.
Schedule attainment
Planned against actual output by day and line, with late orders highlighted.
Cost per unit
Material, labor and overhead per unit from ERP data, compared with standard cost.
Maintenance signals
Work orders, mean time between failures and planned against reactive maintenance.
How does machine data become an OEE figure you trust?
Four steps take raw counts and stops to a figure the whole plant accepts.
Map the sources
We list machines, historians, MES and ERP tables, and note what each one records and when.
Agree the definitions
Operations and finance sign off planned downtime, ideal cycle times and the quality rule.
Build the Power BI model for each line
Counts, stops and defects come together at the agreed grain, with measures documented.
Review with supervisors
Supervisors check the figures against their shift logs in live online sessions before go-live.
Plant systems that feed Power BI for manufacturing
Connections run through databases, exports or a staging layer that your IT team approves.
- ERP systems such as Dynamics 365 Business Central, Finance or SAP
- MES and SCADA historians through their databases or exports
- Quality management systems and inspection records
- Maintenance work order data from your CMMS
- Excel workbooks and SharePoint lists still used in the plant
- Azure SQL or Microsoft Fabric as a staging layer
Power BI pages for supervisors as well as executives
A supervisor needs the current shift: output against plan, open stops and today's scrap. An executive needs the trend across plants. So we design separate pages on one model, rather than one crowded page that suits nobody.
Plant screens work best with large numbers and few visuals. Phone layouts help supervisors check a line from anywhere in the building. Meanwhile, drill-through takes a manager from a plant total to the line and the shift behind it.
For a focused build, a power bi oee dashboard covers equipment effectiveness alone. Likewise, a power bi production dashboard tracks output against plan for the planning team.
Power BI for manufacturing: common questions
Can Power BI read data straight from our machines?
Not directly from controllers. Machine data usually reaches Power BI through a historian, an MES database or an IoT platform. For streaming needs, Microsoft Fabric offers Real-Time Intelligence. We check what your machines already record, because existing data often covers the first release without new hardware.
Can Power BI for multi-plant reporting handle different systems?
Yes. We map each plant's codes for lines, products and downtime reasons to a shared set. Plants keep their own systems, while the model compares them on equal terms. As a result, a plant review covers every site without anyone reworking spreadsheets by hand.
Does Power BI for plant reporting need Microsoft Fabric?
Not always. Many plants start with an import model and scheduled refresh. Fabric helps when machine data is very large, arrives continuously or needs a lakehouse for history. Therefore we size it at the assessment using your real volumes, before recommending any capacity.
How does a Power BI for manufacturing project start?
With a free 30-minute assessment. One of our consultants replies within 2 hours and reviews your systems and goals. Then you receive a written quote with a fixed scope. The work runs remotely inside your own Microsoft tenant, with a demo each week.
Who owns the reports afterwards?
You do. The model, reports and documentation live in your tenant, and we work through accounts you control. We do not copy data to our own systems. Your analysts receive the measure definitions and a refresh runbook, so they can extend the work without us.
Related pages
Let's build your first dashboard together.
Tell us what you report on today. A consultant replies within 2 hours with next steps.
Trusted partners
Microsoft Solutions Partner · AWS Partner
Cloud & AI Platforms
Azure SQL, Microsoft Fabric and the data pipelines behind your reports.
AI Business Solutions
Power BI reporting on your Dynamics 365, Business Central and Power Platform data.
Security
Row-level security and Entra ID sign-in on every report and workspace.
Amazon Web Services
Power BI on your AWS data, with connectors for Redshift, Athena and S3.