A Power BI quality control dashboard that finds defect causes
A Power BI quality control dashboard shows how many units pass inspection the first time, how many fail and why. Quality engineers use it to rank defect causes and to watch whether a process drifts. Our consultants build the model inside your own Microsoft tenant from inspection and production records, and you see progress at a weekly demo.
- First pass yield
- Pareto of defect causes
- Scrap and rework cost
Last updated
What does a Power BI quality control dashboard track?
Quality data piles up fast. Inspectors log checks, machines log measurements, and customers send complaints. Yet the records often sit in separate sheets and systems. So the quality meeting argues over which number is right.
A shared page settles that. It shows yield and defects by line, shift, product and supplier lot, all from one model. Then the team can move from how bad to where and why within a few clicks.
The page also puts a cost on poor quality. Scrap wastes material, and rework wastes labor. When those amounts appear next to the defect counts, a fix that looked optional becomes easy to justify.
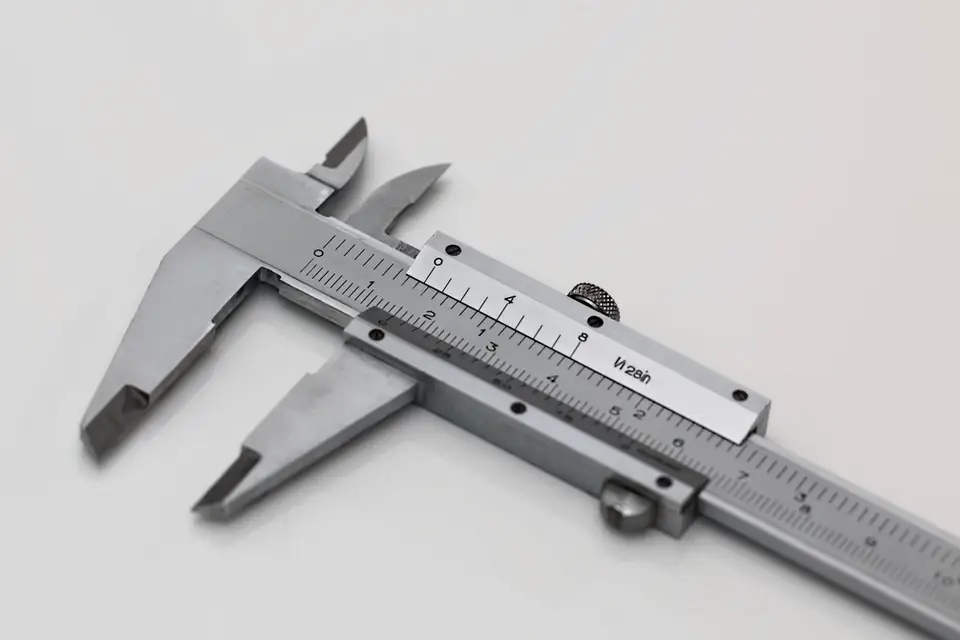
Yield and defect measures used on the shop floor
The definitions below are the common ones in manufacturing quality work.
First pass yield
Divide the units that pass with no rework by the units that entered the process step.
Defect rate
Divide defective units by units inspected. It answers how often a unit fails.
Defects per million opportunities
Divide defects by units times the opportunities per unit, then scale to a million. So complex and simple products become comparable.
Scrap and rework
Count units and cost for each, because rework hides inside a good final yield.
Defect Pareto
Rank defect types by count with a cumulative line. A few causes usually explain most failures.
Customer complaints
Count complaints and returns per units shipped, since escaped defects cost the most.
Which data and model does quality reporting in Power BI need?
Two fact tables cover most needs. An inspection table holds one row per check with the quantity inspected and the quantity failed. A defect table holds one row per defect found, with its type and, where known, its cause.
Both relate to shared tables for product, line, shift, supplier and date. Production output also belongs in the model, because rates need the units made as their base. Without it, a busy week simply looks like a bad week. When those tables come from several plant systems, our power bi data integration services handle the feeds.
Measured values allow a further step. When you record dimensions or weights, a control chart plots each sample against the process mean and limits set at three standard deviations. Power BI can draw this with measures and a line chart. Still, dedicated statistical tools go deeper, and we say so when that is the better fit.
Errors to avoid in a Power BI quality control dashboard
Watch for these six faults before the first quality review uses the page.
- Reporting final yield and hiding rework loops
- Counting defects without the units inspected as a base
- Using free-text defect names that never group
- Averaging yield across steps instead of multiplying
- Mixing inspection date and production date
- Showing control limits that nobody recalculated after a process change
How we build a Power BI quality control dashboard
We begin with the defect list, since clean categories decide how useful the Pareto will be.
Tidy the defect codes
First we group your defect types into a clear, short list with your quality engineers.
Connect inspection sources
We read from your quality system, production system or structured spreadsheets, whichever holds the records.
Build and test measures
Next we write yield, defect and cost measures and compare them with recent quality reports.
Design the review pages
Finally we lay out summary, Pareto and trend pages, then hand the file over with a walkthrough.
Quality control reporting in Power BI: common questions
Can a Power BI quality control dashboard show control charts?
Yes, for standard cases. Measures calculate the mean and the upper and lower limits, and a line chart draws them with the samples. However, Power BI is a reporting tool and not a full statistical package. For advanced rules or capability studies, a specialist tool may serve better, and the report can sit beside it.
How do you build a Pareto chart for quality data in Power BI?
We use a combined column and line chart. Columns show the count per defect type in falling order. The line shows the running share of the total, which a measure calculates. As a result, the reader sees at once which few causes to tackle first.
Can we trace defects back to a supplier lot?
Yes, if your records link them. When inspection or production data carries the lot or batch number, the model relates defects to suppliers and receipts. Then a page ranks suppliers by defect rate. Otherwise we can show only what the data holds, and we point out the missing link.
Does the data have to come from a quality system?
No. Many plants still record inspections in spreadsheets. That works, provided the sheets follow one layout and sit in a shared location such as SharePoint. We often help tidy the template first. Later, when a quality system arrives, the model switches source while the pages stay the same.
How do we engage your team?
Start with the free 30-minute assessment. We then write a fixed scope and reply to questions within 2 hours. Power BI Agency is a division of Sataware Technologies, independent of Microsoft. A small team delivers the work online for US manufacturers, inside your tenant.
Let's build your first dashboard together.
Tell us what you report on today. A consultant replies within 2 hours with next steps.
Trusted partners
Microsoft Solutions Partner · AWS Partner
Cloud & AI Platforms
Azure SQL, Microsoft Fabric and the data pipelines behind your reports.
AI Business Solutions
Power BI reporting on your Dynamics 365, Business Central and Power Platform data.
Security
Row-level security and Entra ID sign-in on every report and workspace.
Amazon Web Services
Power BI on your AWS data, with connectors for Redshift, Athena and S3.