Power BI sales territory analysis for balanced coverage
Power BI sales territory analysis compares revenue, accounts and market potential across regions and reps, often on a map. It shows which territories carry too much, which carry too little and where buyers go unserved. Sales leaders then adjust coverage with evidence instead of instinct. Our consultants build the model in your own Microsoft tenant, and the scope is fixed in a written quote.
- Revenue by region
- Potential against actual
- Balanced rep workload
Last updated
Why does Power BI sales territory analysis matter to a sales leader?
Territories drift. A company draws them once, then customers move, reps leave and a new product changes who buys. After a few years, one rep covers far more accounts than another. However, quotas still assume the old map.
That imbalance costs twice. The overloaded rep neglects good accounts, while the light territory cannot reach its number whatever the effort. So turnover rises in both seats, and leaders often blame skill when the cause is design.
A territory page makes the design visible. It sets sales beside account count, travel spread and potential for each area. Then a leader can see which lines to redraw before the next quota cycle.
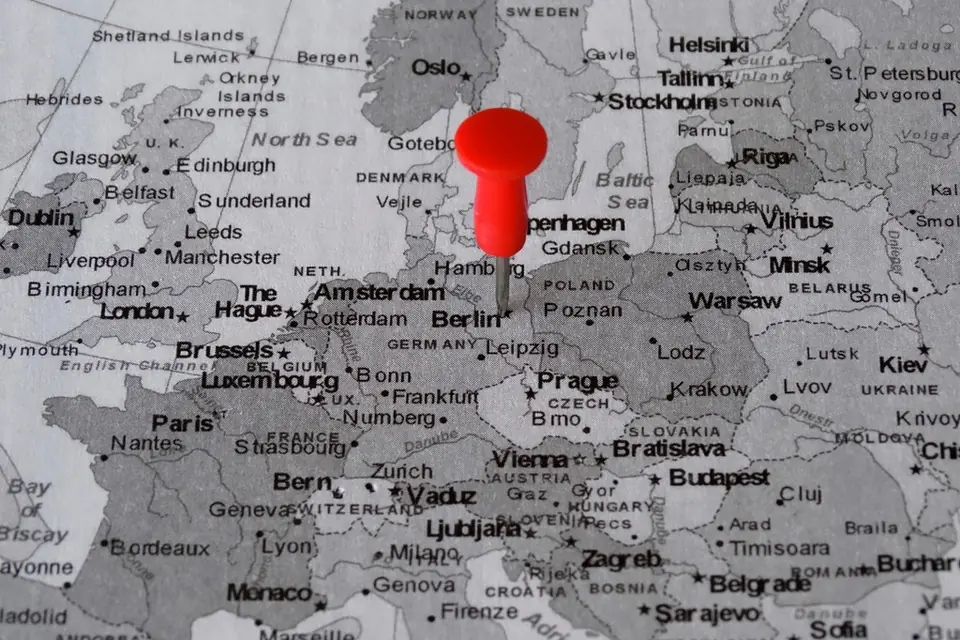
Coverage measures for regions, reps and accounts
Each measure compares territories on equal terms, which is the whole point.
Revenue by territory
Sales and margin show per area against quota and last year. So the ranking has context.
Account load
Active accounts and open opportunities per rep reveal workload, because revenue alone hides effort.
Potential against actual
Your estimate of market size sits beside what you sell there. As a result, thin coverage stands out.
White space
Places with prospects but few customers appear on the map. Then marketing and sales agree where to go next.
Customer concentration
The share of each territory's sales from its largest accounts warns where one loss would hurt.
Win rate by area
Closed and lost deals per region show whether a weak area lacks leads or lacks wins, while both call for different help.
How does Power BI map territories and sales data?
Power BI includes several map visuals. A filled map shades states, counties or postal areas by a value. A shape map can draw custom regions from a map file, which helps when territories ignore standard borders. Bubble maps place a sized point at each customer.
The data side needs a territory table. It assigns each postal code, county or account to a territory and a rep. We keep it as data with start and end dates. So last year's sales can show under last year's map or under the new one.
Potential is the hard input. Some firms buy market data, and others use a proxy such as the number of target businesses in an area. We use whichever figure you trust and label it clearly. Power BI row-level security then limits each rep to their own area, and we set it up as part of the build.
Pitfalls in Power BI sales territory analysis
Territory pages go wrong in a few predictable ways.
- Ranking areas by revenue with no potential
- Hard-coding territory rules inside measures
- Losing history when the map changes
- Mapping by city names that repeat
- Crediting sales to billing addresses only
- Judging reps on unequal territories
How we set up Power BI sales territory analysis
Sales operations joins each weekly demo, so the map reflects how the team really sells.
Collect the rules
First we gather how accounts reach a territory today, including the exceptions people keep in their heads.
Build the assignment table
Next we turn those rules into a dated table that sales operations can edit.
Model and map
Then we connect sales, pipeline and potential to it, and we choose the map visual that fits your borders.
Test a realignment
Finally we load a draft new map, so leaders compare both layouts before they commit.
Sales territories in Power BI: questions leaders ask
Can Power BI draw custom sales territory boundaries for analysis?
Yes, in more than one way. A filled map shades standard areas such as states or postal codes, and you group those into territories with a table. For borders that follow no standard area, a shape map can use a custom map file. We pick the simplest option that shows your regions correctly.
Can a sales territory page in Power BI test a new alignment?
It can. The assignment table holds more than one version of the map. A slicer switches between the current layout and a proposal. So leaders see revenue, accounts and potential per territory under each. That lets them judge balance before reps hear about any change. The final decision still rests on your own judgment.
Where does market potential come from?
It comes from you or from a data provider you choose. Common sources include purchased firm counts, industry data or your own scoring of prospects. We do not invent a figure. Instead we load the measure you trust and show it beside actual sales, with a note on the page about its source.
Can reps see only their own territory?
Yes. Row-level security filters the model by the rep assigned in the territory table. A rep opens the shared report and sees their area, while managers see their region. When assignments change, the table changes and the access follows. Nobody has to edit the report itself.
How do we begin?
Start with a free 30-minute assessment. Call (480) 485-7373 or write to us, and we reply within 2 hours. Power BI Agency is a division of Sataware Technologies, a Microsoft Solutions Partner, and is not part of Microsoft. A small, experienced team delivers the work online.
Let's build your first dashboard together.
Tell us what you report on today. A consultant replies within 2 hours with next steps.
Trusted partners
Microsoft Solutions Partner · AWS Partner
Cloud & AI Platforms
Azure SQL, Microsoft Fabric and the data pipelines behind your reports.
AI Business Solutions
Power BI reporting on your Dynamics 365, Business Central and Power Platform data.
Security
Row-level security and Entra ID sign-in on every report and workspace.
Amazon Web Services
Power BI on your AWS data, with connectors for Redshift, Athena and S3.