Power BI Jira integration for delivery and portfolio views
Power BI Jira integration turns issues, sprints and status changes into delivery reports that managers outside the engineering team can read. Microsoft's Power Query connector list has no Jira connector, so the data does not arrive natively. It comes through the Jira REST API, file exports or a staging store instead. The payoff is a portfolio view across many projects, with the same definitions everywhere.
- REST API route
- Status history captured
- One view across projects
Last updated
How does Power BI Jira integration pull data?
Jira Cloud offers a REST API. A search call takes a query in Jira's own filter language and returns matching issues in pages. An API token tied to an account grants the access.
Power Query can call that API through the Web connector. So a small project can load straight into a report. However, paging through many issues on every refresh takes time, and custom fields arrive under coded names.
A sturdier design stores the data first. A scheduled job pulls issues changed since the last run and saves them, along with their change logs. Power BI then reads that store. As a result, refresh is quick and the history is complete.
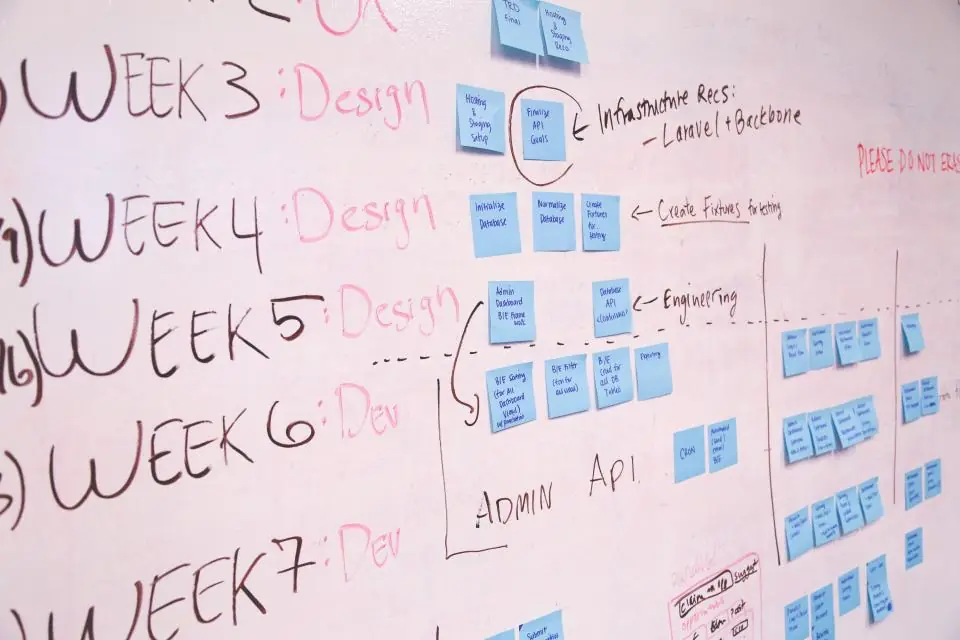
Jira records worth modeling
Six kinds of record answer most delivery questions once they relate properly.
Issues
Stories, bugs and tasks carry type, priority, assignee and estimates, which form the core table.
Change log
Every status move has a time stamp, so cycle time and time in status come from here.
Sprints
Sprint dates and membership show what a team committed to and what it finished.
Epics and parents
Parent links roll work up to larger goals, while portfolio pages then compare initiatives.
Work logs
Logged hours per person and issue support effort tracking where teams record time.
Versions and components
Release and component tags split the backlog by product area and delivery date.
Why do custom fields and workflows cause trouble?
Each Jira site grows its own custom fields. The API names them with numbers, not labels. So story points may hide behind a code that differs from one site to the next. We map those fields once and store the mapping.
Workflows differ as well. One team has five statuses, while another has twelve. Therefore a portfolio report needs a shared set of groups, such as to do, in progress and done. Jira's status categories help, but they seldom match how leaders think about work.
We agree that grouping with you first. After that, cycle time means the same thing for every team. Without this step, a dashboard just compares teams on unequal terms.
Questions a Power BI Jira integration can answer
These are the six views that delivery leads ask for most.
- How long work takes from start to done
- Where issues wait longest in the workflow
- How much planned sprint work gets finished
- Whether bug volume rises after releases
- How the backlog grows against throughput
- Which initiatives absorb the most effort
Our steps for Power BI Jira integration
Four stages take the project from API access to a shared delivery dashboard.
Agree measures
First we define cycle time, throughput and done with your delivery leads, since teams often differ.
Set up access
Then an admin issues an API token for a service account that can browse the chosen projects.
Load issues and history
Next we build the incremental pull, map custom fields and turn change logs into a status table.
Publish portfolio pages
Finally we build team and portfolio views, and coach leads on reading flow measures.
Questions on Jira data in Power BI
Is there a native Power BI connector for Jira?
Not on Microsoft's connector list. We therefore avoid promising one. The dependable routes are the Jira REST API, exports and a staging store that Power BI reads. Marketplace apps from third parties also offer ready links. They can work well, yet they cost a subscription and need approval from whoever governs your Jira site.
Can a Power BI Jira integration combine many projects?
Yes, and that is its main strength. Jira boards show one team at a time. A model in Power BI holds every project with shared status groups and dates. So a director sees flow across the portfolio on one page, then drills into a single team when a number looks odd.
Does Power BI work with Jira Data Center?
It does, with a different access route. Data Center runs on servers you host, so its REST API sits inside your network. An on-premises data gateway or a job inside the network bridges that gap. The modeling stays the same. We ask which edition you run on the first call, because it changes the plan.
Will reports show who is slow?
We advise against that use. Flow measures describe a system, not a person. Reports that rank individuals push people to game ticket states, and then the data loses its value. Instead we focus pages on teams, work types and bottlenecks. That keeps the numbers honest and the talks useful.
How do we start with Power BI Agency?
Start with the free thirty minute assessment. You show us a board and the questions you cannot answer today. Then we send a written quote with a fixed scope. The work is remote, inside your own Microsoft tenant, with weekly demos. We reply to every inquiry within 2 hours.
Let's build your first dashboard together.
Tell us what you report on today. A consultant replies within 2 hours with next steps.
Trusted partners
Microsoft Solutions Partner · AWS Partner
Cloud & AI Platforms
Azure SQL, Microsoft Fabric and the data pipelines behind your reports.
AI Business Solutions
Power BI reporting on your Dynamics 365, Business Central and Power Platform data.
Security
Row-level security and Entra ID sign-in on every report and workspace.
Amazon Web Services
Power BI on your AWS data, with connectors for Redshift, Athena and S3.